_Logo%20horizontal%20bleu%20et%20vert-1.png?width=1398&height=422&name=(RVB)_Logo%20horizontal%20bleu%20et%20vert-1.png)

Choosing the right location is the most crucial decision one can make when opening a coffee shop. With GIS based location analysis the crucial decision becomes an easier one.
To find the best location, let us consider the data of shopper’s population, day and night crowd concentration, purchasing and spending power, existing store locations as well as competitor locations to find the best place to pitch the store. The probability considered here is that people tend to visit coffee shops near their residence or work place rather than the far one.
Understanding the Daytime and Nighttime population
The consumer based calculation on where they reside and where they work is an important aspect to consider for a trade potential. Daytime populations of some communities may swell substantially during the day, particularly those that have a workforce population coming into the city for work and commuting elsewhere at the end of the day. This expanded population can further define and measure a community’s consumer base and be a predictor of retail attraction and expansion opportunities. For an optimized location in Delhi, let us consider the population data and purchasing capacity of non- alcoholic beverages with existing POIs. Delhi being subjective to extreme climate variations coffee has become a habit and the coffee pubs are trying to sell a lifestyle for people.
The base data used for analytics is Here maps POI’s (including existing competitor locations and other day time and night time POI's) and road network. The add on data for creation of 1km*1km Grid are from MBR which brings in statistical dimensions to the analysis like purchasing power and spending power in million rupees.
Zonal Analysis for Geo-marketing research.
For better precision and accuracy, the research has been performed on squares of territory, 1km*1km. We carried out a customized assessment using the population data and the purchasing capacity on non-alcoholic beverages with the existing POIs to get down to an optimized location for the coffee house. The resulting grid along with further analysis will represent a heat map of the target consumer distribution on the designated territory with data on how many people are potential consumers per km2
A day time and night time population shift breakdown can bring more spatial insights to the research. During day time people tend to move towards banking areas, offices, factories, shopping areas, parks, tourist spots etc and night time population get focus on residential areas.
An aggregation of the day time and night time population based on the density distribution for each activity class they belong to can be used as the total shopper’s population grid. Here the priority of migration will be given for day time population (due to possible higher intake of coffee) over night time.This population density will give you the desired base for analysis.
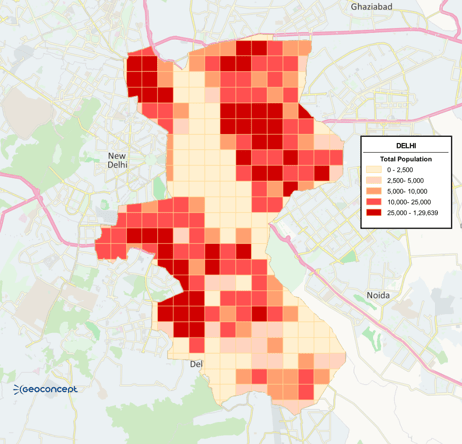
As per the government statistics the average population density of Delhi is 9,340 per sq.km. So our analysis will focus on the highly populated area of Delhi where the population is over 25000.
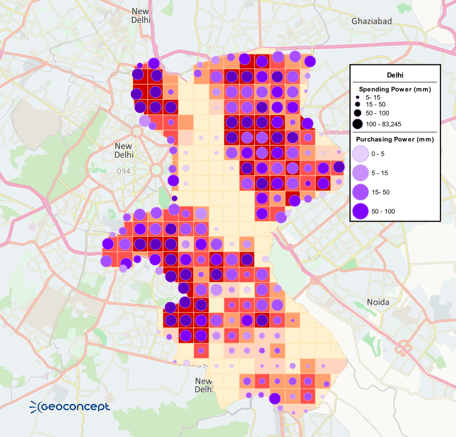
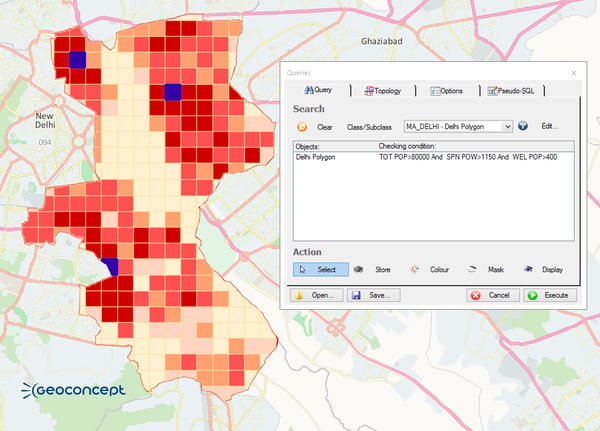
Further the purchasing power on wealth population on these high density areas are overlaid with the spending power of the crowd on non-alcoholic beverages for analyzing the potential locations for a coffee house. This gives the hotspot areas for detailed analysis.
Clubbing the acquired hotspots with the existing branded coffee shop can be used to calculate an accessible market size. Thus this analysis allows the retailer to spot a potential catchment for opening a profitable coffee shop with the a drive time of 5, 10,15 minutes in the city. The visualization of the same using Geoconcept looks like this:
An emphasized hotspot areas were identified by a combined analysis of densely populated areas with wealth and spending trend of the crowd.
The identified hotspots were found to be near historical area with tourist attraction, parks, shopping complexes, IT sector or hangout spots when cross verified. This can be a validation on ground level. The highlighted zones are thus analytically and geographically potential for a successful coffee house.